Graphical Identification of Cancer-Associated Gene Subnetworks Based on Small Proteomics Data Sets

Abstract
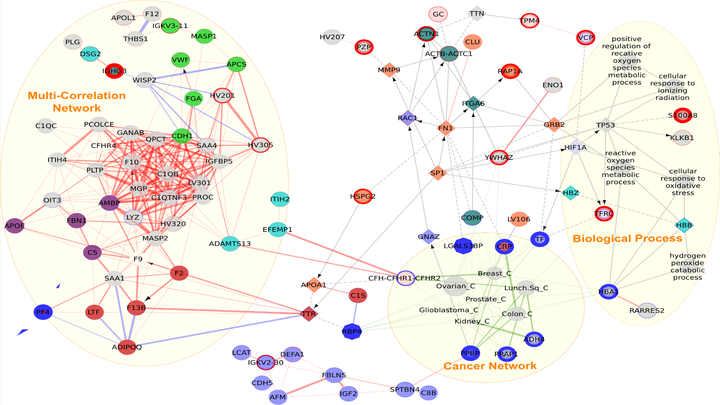
Proteomics is a rapidly emerging frontier in post-genomics medicine and biology, but the quantitative analysis and validation of proteomic data are in need of further improvements. Before selecting potential candidate proteomic biomarkers, it is important to understand the broader context of how biological processes are regulated under different conditions or in different phenotypes. The enrichment of proteomic data consists of extracting as much biological meaning as possible from curated, pathway-based, functional protein interaction networks. Currently, most of the enrichment tools are intended for microarray data and require parametric data, whereas proteomic data are often nonparametric. In this study, we aimed to select a suite of interactive tools that can enrich proteomic results with a graphical overview. This facilitated diagnosis and interpretation prior to further analysis. From a list of proteins, a network was constructed using a map of the most severely disrupted biological process, and the disease entity was then identified on the basis of clinical data. Taken together, this graphical and interactive method ranks potential proteins via functional analysis in order to improve the choice of biomarkers for validation with the following advantages- 1) It adds neighbor proteins that are not selected by mass spectrometry analysis, but could in fact be key proteins; 2) pinpoints the biological process most often involved; and 3) predicts the most likely disease on the basis of clinical data.
- OMICS: A Journal of Integrative BiologyVol. 17, No. 7*